Marketing Analytics- the new hot cake in the market. Every company is trying their best to utilize analytics in order to improve their performance, visibility, campaigns and what not! Have you ever wondered why? Let us read about classification algorithm for marketing analytics.
The trail of data that this era’s customers leave is huge, and definitely an untapped gold mine! And tapping it won’t just benefit the companies but customers like us too! It helps them in personalizing our experience and be at the right place at the right time, for the right people.
You as a marketer, by now would have noticed the trend of Machine Learning and Data Science going viral. And that’s because they can help in giving conclusive reasoning and quantitative insights to work on. In the field of marketing, you may get a lot of raw data. And mind you, naked eyes won’t be able to detect any patterns in them.
So, what to do? What are the different types of classification algorithms? Which algorithm will work? What to tweak in it?
The answer is start learning Data Science. And if you have already started and went through few blogs and sources, you would have come across Classification and Regression Algorithm terms.
You would almost see “Classification and Regression” always together. Are they similar? Are they different? How to use them?
Well, both are fairly important for us. But today, I aim at telling you how to use the Classification Algorithm for Marketing Analytics. Even provide you a step-by-step example of the same.
Do Read our article: Linear Regression for Marketing Analytics [Hands-on] for Regression Model.
Machine Learning for Marketing Analytics
You may already have the understanding of the fact that machine learning algorithms can be broadly divided into two categories: Supervised and Unsupervised Learning.
Let me tell you about those in brief. (Though if you want to know more refer to the following video!)
In Supervised learning, you train your model using data which is well "labelled." It means some data is already tagged with the correct answer. It can be compared to learning which takes place in the presence of a supervisor or a teacher.
Whereas in unsupervised, you do not need to supervise the model. Instead, you need to allow the model to work on its own to discover information. It mainly deals with the unlabelled data.
Now under supervised, we get two major categories: Classification and Regression.
There is an important difference between classification and regression problems. Fundamentally, classification is about predicting a label and regression is about predicting a quantity.
Now without further ado, lets jump into our topic- “Classification Algorithm for Marketing Analytics”
What is Classification?
In the upcoming paragraphs, let us understand what classification is and how it is important for an MBA graduate leaning marketing analytics.
Classification is the process of predicting the class of given data points. Classes are sometimes called as targets/ labels or categories. It’s not always binary, but always discrete.
In mathematical term, classification predictive modelling has the task of approximating a mapping function (f) from input variables (X) to discrete output variables (y).
For example, I believe we all get many spam mails daily. And fortunately, we don’t have to waste our time on them, in our inbox. Classification algorithm is how your email-server does that!
Spam detection is a binary classification problem. As there are only 2 classes as spam and not spam. In this case, classifier utilizes some training data to understand how given input variables relate to the class. In this case, known spam and non-spam emails have to be used as the training data. When the classifier is trained accurately, it can be used to detect an unknown email.
There are many applications in classification in many domains. Such as in loan defaulter detection, medical diagnosis, target marketing, Spotify’s song genre creation, etc.
What are the different types of classification algorithms?
Machine learning uses human-like terms. And hence its models are sometimes called as “learners”, based on the way they learn from the dataset. There are two types of learners in classification as lazy learners and eager learners.
Lazy learners
Lazy learners simply store the training data and wait until a testing data is given. When it does, classification is conducted based on the most related data in the stored training data. Compared to eager learners, lazy learners have less training time but more time in predicting.
Ex. k-nearest neighbour (KNN), Case-based reasoning
Eager learners
But in case of eager learners, they build a classification model based on the given training data before receiving data for classification. They must be able to commit to a single hypothesis which covers the entire instance space.
Due to the model construction, eager learners take a long time for train and less time to predict.
Ex. Decision Trees, Artificial Neural Networks
Let’s pick one of the models and understand how they work. And more importantly, how to use them and interpret their outputs!
What are the different types of classification algorithms? Do we have to learn each one?
Well that knowledge will come with practice. For now, since our intent is not to learn blow-by-bow about the details, lets pick the most common model- decision tree.
Yet, if interested go through this: Commonly used Machine Learning Algorithms (with Python and R Codes)
Decision Tree Algorithm:
Decision tree is one of the predictive modelling approaches used in statistics, data mining and machine learning.
It has a flowchart-like structure in which each internal node representing:
1- A test on a feature (e.g. whether a coin flip comes up heads or tails),
2- A leaf node represents a class label (decision taken after computing all features)
3- Branches represent conjunctions of features that lead to those class labels.
4- The paths from root to leaf represent classification rules.
To be honest, it rather looks like an inverted tree
Now, how does information flow through this?
In simple terms, for each node of the tree, the information value measures how much knowledge a feature provides us about the class. The split with the highest information gain will be taken as the first split. And the process will continue until all children nodes give 0 information. (Or meet the termination condition)
For extra detailed knowledge read: towardsdatascience.com
Now let’s see a step-by-step process, to understand what should be your approach as an MBA!
Customer classification example [Step-by-step]
The objective of this example is to identify donors, for charity purposes.
For a marketer similar approach could be done to identify suitable influencers, loan defaulter, or even categorizing your products.
My favourite was Spotify’s approach in creating genres. They did it so perfectly, that now its one of the reasons why we heart Spotify!
Let’s Begin:
1- Download and Quick-Scan of the Data
I used a modified version of data mentioned in “Scaling Up the Accuracy of Naive-Bayes Classifiers: Decision-Tree Hybrid”, by Ron Kohavi. You can download the same from UCI.
Here you can get the data file and dictionary for your use.
Let’s scan through some features in brief.
Features:
age: Age
workclass: Working Class (Private, Self-emp-not-inc, Self-emp-inc, Federal-gov, Local-gov, State-gov, Without-pay, Never-worked)
education_level: Level of Education (Bachelors, Some-college, 11th, HS-grad, Prof-school, Assoc-acdm, Assoc-voc, 9th, 7th-8th, 12th, Masters, 1st-4th, 10th, Doctorate, 5th-6th, Preschool)
education-num: Number of educational years completed
Rest of the 13 features had info like sex, native country, capital gain and loss etc.
Now the column whose value you want to predict!
Target Variable:
income: Income Class (<=50K, >50K)
This is done to just have a rough idea about what kind of information is provided.
2- Import Libraries and Import Data to the platform
I used Python for this (on Spyder (Anacoda3)). And saved the file as “Decisiontree.csv”.
Code:

Output: The Output of the code is given below

These little snippets of libraries can make a huge difference! They contain pre-coded tasks, so that you don’t have to start from the scratch.
So, its really important that you know which ones to use and save your time!
Pro Tip: If you haven’t done coding before, learn R or Python. The users have a huge community! And thus, you can get almost every codes and error resolutions on the net!
3- Exploratory Data Analysis (EDA)
Usually, I prefer doing this using Pivot function in Excel. But that might not always be a good option. For instance, if your data is huge, Excel might hang ☹
To do this in python, I used the following
Code-
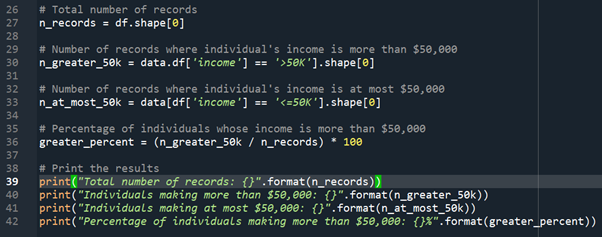
Output: The Output of the code is given below

Why to do EDA?
This step is extremely crucial!
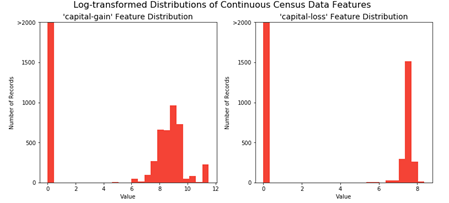
You could notice of your data is positively or negatively skewed. Or is it heavily imbalanced. After this you can decide what kind of class treatment your model focus on
In our case, Capital gain and loss had a skewed distribution.
4- Skewness Treatment
In order to normalize the skewed numerical values, we use logarithmic transformation. And this step also ensures equal treatment of the features.
Code-
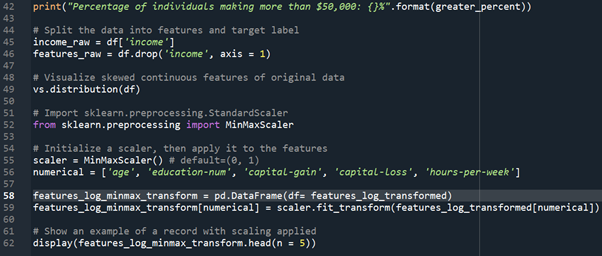
Output (after log transformation)
5- Converting Categorical Features
Categorical features have a huge amount of information in them. But your model can’t use them. Then what should we do? Remove it?
NO! The solution is simple! You convert them to numerical features. And the best way to do that is “One-hot Coding”.
Code-

This step makes dummy columns and saves binary values to capture information.
6- Test/Train Split (followed by model training)
Here I have split the train-test in 80-20% split. You can import libraries for multiple models and see how they function. That’s the best way to decide which model works for you!
Code-
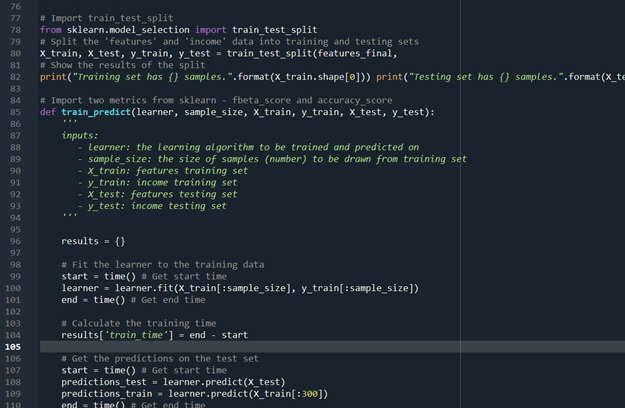
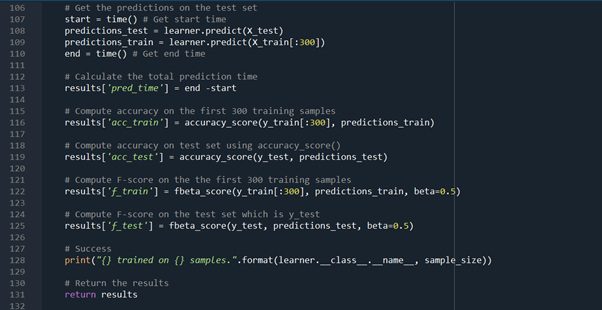
Now the most important step, atleast for an MBA- Interpretating results.
7- Confusion Matrix
When making predictions on events we can get 4 type of results: True Positives, True Negatives, False Positives and False Negatives. All of these are represented in the following classification matrix:
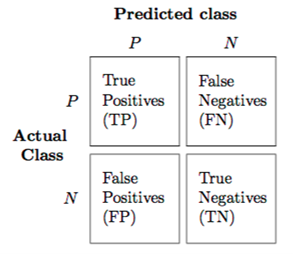
Confused about confusion matrix? Read this article: Confusion matrix explained
You should be well-versed with these terms- Precision, Recall, Accuracy, F1 Score. AUC Curve
Because each of these are derived from the same confusion matrix, but tells you a different thing!
As an MBA this would be expected out of you to make sense of these numbers.
8- Iterations
After this step, the major task dependency shifts to the data analyst team. In order to refine your results, a lot can be done.
Like for example, feature engineering followed by feature selection. In order to train your model better. Or over/under sampling to treat class imbalance. Or model tuning.
Your Mantra becomes: Add. Select. Iterate!
Classification Model Uses in Marketing
Classification models are a favourite for FMCG firms. They use Marketing Mix Models (MMM), to enhance the efficiency of their advertising platforms. Use it for product classification too!
There are four types of product classification — convenience goods, shopping goods, specialty products, and unsought goods.
For loan default detection, banks also use this. They have a huge amount of data, owing to the documents we submit for personal loans. Classification plays a major role in that detection.
The uses of these models are infinite. Isn’t that amazing?
Conclusion
Whatever you learned in this discussion is more than sufficient for you to pick a simple dataset from your work and go ahead to create a classification model on it.
This article meant to tell you the flow of the analysis. How to start your project? What to expect? And how to understand it.
You can now pick any small dataset. If you can’t find one, you can use NYC Uber Trips Data. And use it to classify which time/customer is suitable for you.
Further, if you want to speed up the process of learning Marketing Analytics you can consider taking up this Data Scientist with Python career track on DataCamp.





Thank you for nice article. I learned a lot on how to start a proper project.