I had started off with a series in which I plan to cover the most important frameworks that a marketing strategist should know. I covered the Ansoff Matrix before this in a separate article. The BCG Matrix is the next in line and the point of discussion of this article.
In this article, I also explain how BCG Matrix can find a good use in Digital Marketing, something which I realized while analyzing a few of my Facebook Ad Campaigns.
Also, I share the example of one of IIM Udaipur’s alumni, Angad Abrol, and how one of his start-up ventures serves as a perfect example to explain the BCG Matrix.
This article on the BCG Matrix flows quite naturally from previous on Ansoff. While the Ansoff Matrix helps you as a marketer understand his or her product strategy, the BCG Matrix will give you an overview of your product portfolio. Which product is doing well, which one is just doing fine and which one is in a really bad shape.
Every business needs to have products that churn the wheels of profit, and the BCG matrix will help you spot those products.
“Between calculated risk and reckless decision-making lies the dividing line between profit and loss- Charles Duhigg “
Let me quickly take you through the BCG matrix after which I will talk about what can you really do with.
What is the BCG matrix definition?
BCG matrix stands for Boston Consultant Growth Matrix and is also known as Growth share matrix. It provides the businesses with a framework to analyze products according to growth and market share.
If I had to rather explain BCG growth matrix to you in simple terms I would say again that, if you are working on a big product portfolio (maybe at an FMCG company) then the BCG matrix growth share can give you a very quick overview.
BCG matrix is in use ever since the 1968 and has been helping the organizations to gain insights about which of their products will help them to capitalize on the current market share growth opportunities.
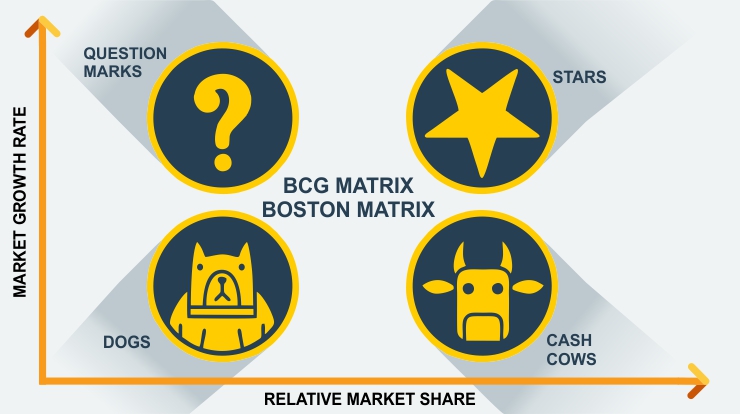
Now, if you observe the BCG matrix diagram, it is divided into four different quadrants which will allow you to find the role a product plays in your profit margin.

The role of BCG matrix in strategy management has been immense and corporations have relied on this framework for the last 50+ years. This article discusses its implications for a marketer.
Here is what each quadrant means in the BCG Matrix.
Stars (High Growth, High Market Share)
The products that fall into this category are those that hold the best market share and generate the most revenue for the company. Star products also require a lot of investment for gaining excess market share.
Example:
For instance, a new smartphone launched by Apple will require high investments in its research & development, marketing, and promotions to gain higher market share and better growth.
The products that fall into the star’s category can become cash cows (explained later) if their growth is sustained for a longer period of time.
Question-mark (Low Market Share, High Market Growth)
The Question mark products, the ones that fall into this category require a lot of investment but they give a comparatively lesser amount of returns.
Now usually you would find that question mark products are basically those products that are yet to be established and accepted by the market. There is a lot of uncertainty around these products and therefore the question mark.
Or, it could also be that these are the products are of those companies that are in process of branding themselves even now.
These products require a lot of their investments in marketing and promotional activities.
They can be a potential loss to the company however, uncertainty still prevails as they have a high market growth and can also be potential stars.
In the dynamic business environment now, where everything is uncertain, companies have to do SWOT analysis on a constant basis to know their pitfalls and work on them.
Therefore, a SWOT analysis exercise along with the BCG Matrix helps to understand the destiny of the question-mark products better.
Example:
With zero potential where all the companies have withdrawn their old handsets, in the year 2017 Nokia has made a comeback in the market with their retro handset with Nokia 3310.
By selling us nostalgia, Nokia not only recreated the 2000’s era for us but also earned profits, now this is the magic of the BCG matrix’s question mark products, indeed their unpredictable!
Cash cow (High Market Share, Low Market Growth)
Every marketer loves the products that fall into this category, they are the big-time revenue earners of the company. They are the pillars that help the company to be recognized in the market.
Cash cow products require a very low investment in comparison to their returns and other products. Usually, the profit earned from these products are reinvested by the companies into diversifying their business and the question mark products.
The cash cow products have been able to sustain the period of growth and have also very well retained their market share.
Their predominant nature does not demand higher returns however the companies are still advised to manage these products to maintain their stability.
Example:
Maggie. Where the competitors expected that after the big blunder the sales will never be able to recover, Maggie is one such example that has wrestled every downfall and still managed to be a cash cow product.
Dogs (Low Market Share, Low Market Growth)
The products that fall into this category are basically the ones that are able to just reach the breakeven sales, with no profit and no loss in hand.
These products are basically considered to be the cash trap for the company as their investments have been tied up in these products and cannot be liquefied.
Example:
Now one such example of this, currently, our government is shutting down the Dog products by using the disinvestment procedure, all the PSU’s have been now open for private investment.
A great example of Cash Cows and Question Marks
I owe this example to Angad Abrol, an alumnus of my B-school Indian Institute of Management (IIM), Udaipur. He happened to visit the campus today and was out there to meet us.
Angad is a serial entrepreneur and has found a lifestyle around start-up hoping, creating one successful start-up after another.
Sharing the story of his latest start-up, an Artificial Intelligence and Data Science based company in New Delhi he told us about their core products. This is a 24 people strong, roughly 4-year-old start-up.
They develop AI solutions for HR Analytics and Talent Scouting. He explained beautifully how all of it would unfold for a company who subscribes to their solution.
That is their core solution.
Along with that, he mentioned how they have a lead generation platform for B2B companies which they have created. Not very unique. Not even their core business. But as it turned out it earned them 80% of their revenue!
Now, this start-up has nothing to do with lead generation at its core. And certainly, their focus is completely towards their AI based HR solutions. The HR Analytics solution, here, is the question mark business. High Market growth rate but a comparatively lesser growth rate of the company, which, to be fair is still up-and-coming.
But it is this cash cow that the lead generation business is for them that earns them the money which helps them plug that income into their core AI business and develop it – hence remaining efficiently bootstrapped.
What to do with the BCG Matrix?
With the idea of what exactly is a BCG Matrix in place, it is worthwhile to understand what all things can you do with it.
From the way I understand about the BCG Matrix or for that matter any marketing and management framework, always try to use a couple of them together.
It helps in many ways. The analysis of just one framework leaves to many things open to subjectivity. One framework cannot cover the complexities of many businesses completely.
Here are a few things that you can do with the BCG Matrix:
1. If you wish to take an investment decision into your products and brands, the BCG matrix will tell you where to pump the money.
2. Not just that, you could apply the BCG Matrix in the field of Digital Marketing as well just like I do
- If you run a bunch of campaigns on Facebook Ads or on AdWords you would always be required to choose which campaigns are your preferred ones.
- It pays to analyze this by setting up all your campaigns in a BCG Matrix.
- I find one or two of my campaigns that require less money and are producing clicks or conversions at a very low cost. These are the cash cows. In the landscape of aggressive marketing by everyone around the country, these campaigns still deliver the best.
- Then there would be campaigns that require investment – are generating clicks and engagement but not enough conversions. You may have a temptation to stop them but they are doing some bit of brand building, but then they are expensive. These are the Question Marks.
- Need I explain the dogs?
3. If you plan to launch a new product and are not sure which kind of product, use BCG and Ansoff in conjunction. With the help of BCG Matrix understand which kind of products are doing well.
Then apply the Ansoff Matrix to understand whether you can use the same products in new markets or do you need to get an absolutely new product.
Also Read: The Ansoff Matrix
Conclusion
BCG matrix diagram also very well explains that how it ensures that the product’s portfolio analysis is done right, BCG matrix in strategy management or for marketers will help you march on the right path of product and corporate level decision. This also makes it imperative for the companies to scan their environment and products every now and then.
“Owning a variety of asset classes means that some part of your portfolio will be doing well when the cyclical turmoil arises, Keep an eye on it!”


