We live in a world that keeps piling more and more data. The companies that successfully leverage their data can significantly improve their sales. Well yes, data may be the currency of the new world but you may wonder as a marketer, what is the importance of statistics in business management or more precisely, the importance of statistics in Marketing?
Let’s discuss some of very common and also upcoming marketing techniques that use statistics to make sense of the silos of data a company owns.
Statistics in Marketing
Statistics is the discipline that is concerned right from collection, organization, analysis and interpretation of data to make sense of it.
To understand the application of statistics in marketing, let us consider the example of Target, one of the largest retailers in the US.
Target employees noticed certain patterns in their customer's shopping carts. Women in the baby section were buying large quantities of unscented lotion, and mineral supplements during pregnancy.
Based on this insight, Target made a list of 25 items which were bought by pregnant customers. This helped them create a model that predicted with great accuracy if someone was pregnant or not if they bought some products. Once they predict it, they can provide these customers with special offers and as a result boost sales.
Read Further: Curious Case of Consumer Analytics at Target Retail
But enough chit-chat. Now let's get down to business and discuss in detail certain marketing methodologies to try and understand why marketers need a solid understanding of statistics and the various application of statistics in business management and marketing strategies.
Attribution Model
Companies spend a pretty penny on digital marketing to promote their products on various platforms ranging from social media, website ads and search engine ads.
At the end of a certain period, the marketing manager needs to calculate the ROI from each of channels to justify his or her spending on them or maybe to identify which platforms are performing better than the others in bringing in more leads or sales.
Due to the complexity of the digital world we live in, it becomes difficult for companies to accurately calculate the ROI from each platform. This is where statistics comes to the rescue.
Consider an example. You want to purchase a jogging shoe and you google the same. The resulting search page will contain a bunch of ads from various websites and eCommerce platforms.
After spending some time searching you like a pair but decide not to buy it right now. A day later you the ad for the same pair of shoes on a random website and you reconsider buying it. Another day later you see the same ad on Facebook and this time you buy it.
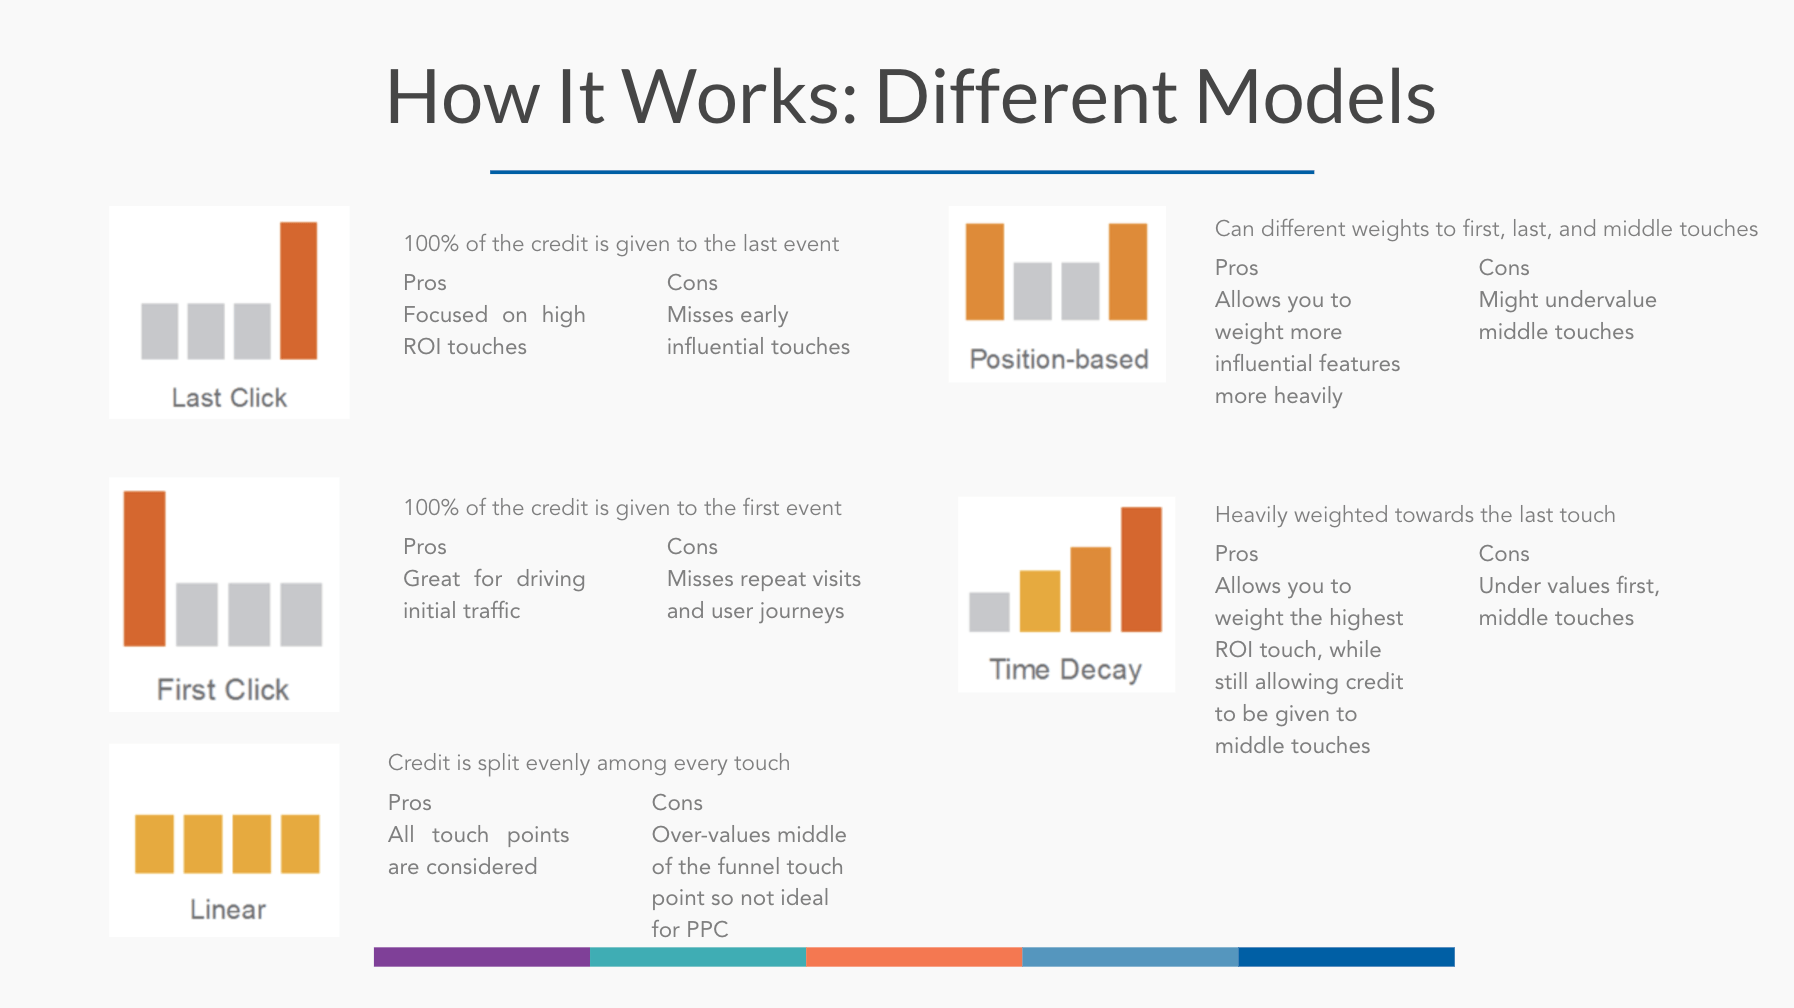
Now, which of these platforms gets the credit for your purchase? The model that tries to decide this is called Attribution model.
Types of attribution models used,
There are a variety of attribution models available but as you can clearly see none of this captures the accurate amount of role each of the platforms played and works on assumption.
Hence we use statistics here to utilize available data and build a model that takes into consideration the entire customer journey.
Data-driven attribution modelling uses statistics to calculate the actual contribution of each search ad click along the conversion path. This model has seemed to provide better results than the last click model which has been predominantly used.
For example, when Adidas adopted the econometric attribution model it helped it understand its customers better. Adidas assumed that most of its sales come from loyal customers so it started investing in CRM only to realise later with the new model that 60% of the sales came from new customers.
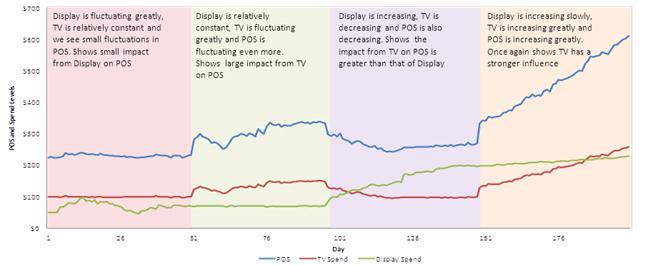
In the above picture, the attribution of sales due to the ad spending on TV and Display ads can be calculated using an econometric model.
This model uses data from the Point-of-sales (POS) systems from various stores, ad spending on TV and Display ads and the insights gained from the model is mentioned.
Market Research
Market Research is as an organized effort to gather information about target markets and customers. It is extremely important to know how customers and potential customers view or perceive a company or a brand to help unravel new opportunities.
Market research is usually done in two ways,
Qualitative Research
When researchers collect and analyse non-quantitative data like audio, video etc to gain insights and opinions of the respondents then it is called qualitative market research.
Examples for this can be focus groups and personal interviews.
Quantitative Research
When quantitative information like numbers, for example height, age etc is collected and analysed it is called quantitative research. It can be used to predict future outcomes, identifying patterns hidden in data and to extrapolate the sample findings to a wider population.
This involves surveys, questioners and polls etc.
Market research relies heavily on statistics to systematically analyse the collected data from the customers. It is used to draw insights from data, make predictions and determine the accuracy of its predictions with a certain confidence.
Steps in Marketing Research
Below we will discuss the list of steps used in the market research process and the statistics in marketing methods utilized during each of these steps.
Data Collection and Processing
Survey designing and sampling forms the foundation of the entire process. A badly designed survey will ruin the whole process as any findings from it will not be reliable.
Sampling techniques are used to identify the accuracy of the sampling that was done to get the data. Then summary statistics are used to summarize the data using functions like mean and variance to get a general feel of the data.
Data Analysis and Modelling
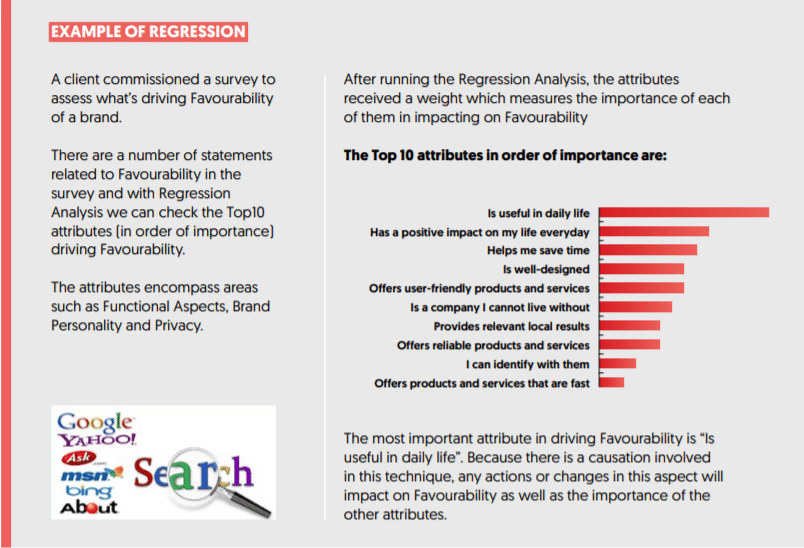
Next phase involves the modelling of the data to look for any relationships within the data. Methods like correlation and regression etc, are used to find connections among the data and use it to make predictions.
For example, does temperature really play a role in the sales of ice cream?
We can try to find the correlation between the two using the temperature data for a given number of days and the corresponding ice cream sales. If increase in temperature increases the sales, then we say that the two variables are positively correlated.
Once we find this, we can predict how much increase in ice cream sales you can expect if the temperature on a given day was a certain value using regression.
If you want to get into the nitty-gritties of how to do regression analysis, check out our easy step by step guide.
Marketing Mix Modelling
Let's say, for example, a company wants to increase the sales of a particular product. They decide to decrease it’s price by a certain amount and simultaneously increase the ad spending for the product on TV and newspapers.
As a result of the sales of the product increases but the company still doesn’t know what caused the increase in sales or which factor played a bigger role in increasing sales.
Was it the TV ads or price reduction?
This is exactly where marketing mix and its modelling come into the picture.
Marketing mix is a set of tactical strategies that companies use to fulfil their marketing and sales objectives for a period. The mix consists of changes made to Product, Price, Place and Positioning, also referred to as the 4P’s of marketing.
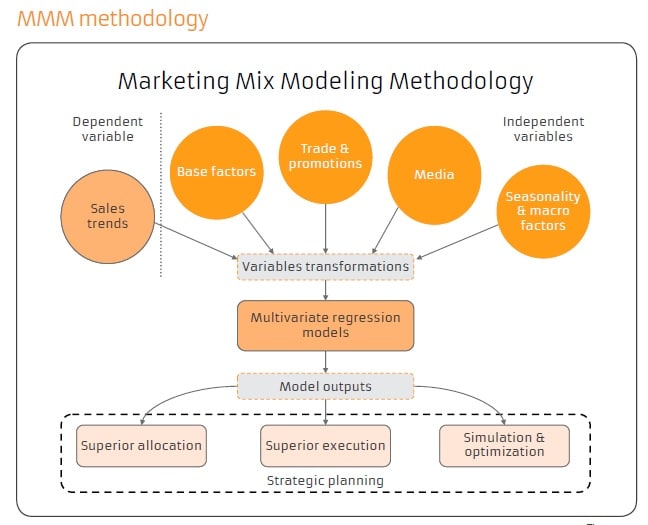
Whereas, Marketing Mix Modelling is a statistical analysis that helps the company to find the effectiveness of its marketing strategies. Not just that, it can also help the company to predict and forecast what changes they can expect due to these strategies in the future.
One can use the sales data as a time series and use it to build a regression model that can forecast the future impact on sales due to the marketing mix strategies.
It can also provide insights into ROI by marketing activity, contribution by activity and help figure out optimal spends for them.
Precision Marketing
Most of the ads that we see online when we visit a website or social media might be irrelevant for us. That’s because most companies still follow the traditional ways of marketing.
In the new world where data is considered as the new currency, many companies are trying to get as much data as possible of their customers to understand their personalities and needs to provide them what they actually need.
One way to accomplish this is by using Precision marketing. Companies use the data they have to group their customers based on their demographics, psychographics, beliefs etc into relevant micro-segments.
Market segments are usually very broad but in micro segmenting we get into the specifics.
For example, market segments can be Men between the ages of 20 to 30 years whereas micro-segment could be Men between the ages of 20 to 30 years living in metro with an outgoing personality and avid football fans.
Companies use this type of deep segmentation to make meaningful cohorts that have similar needs. Then they can create offers and discounts custom for each of these cohorts and advertise where they are more likely to be present to create customer loyalty.
For example, Unilever in Thailand is employing various methods to understand their customers better and create micro-segments for better customer satisfaction.
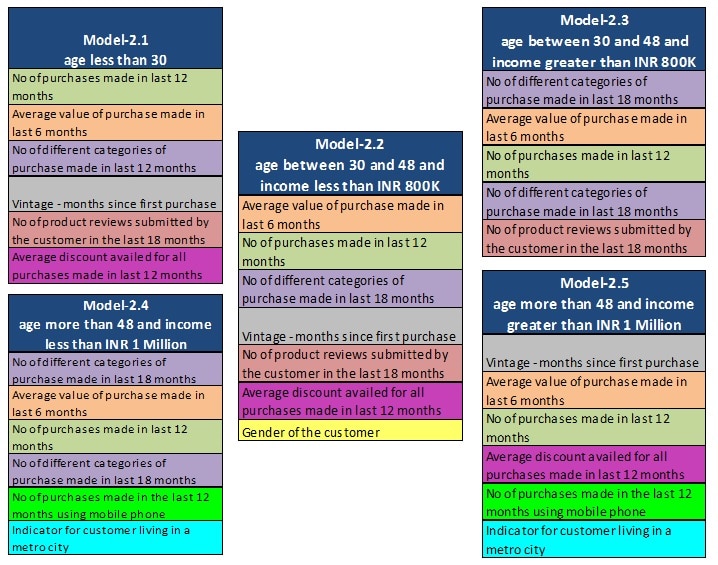
To create these segments, it’s time to ask our friend Statistics for help. Segmentation Models that are accurate in predicting the desired output are created using linear and logistic regression methods and segmentation methods like CHAID and CRT to judge their effectiveness.
Conclusion
In this article to tried to get a glimpse of the role of statistics in marketing to understand why marketers need a solid understanding of statistics. We saw a few areas that are very helpful in coming up with effective marketing strategies for any company.
Though marketers do not need to turn into data scientists, understanding the role of statistics in management science and keeping up to the date with skills that will augment marketers make a better-informed decision is any day a plus.
Also Read: Statistics 101 for Data Science
Also Read: Linear Regression from Scratch to Pro

